- How The Grinch Stole the Rivalry
- 9-Line Prediction: BYU v. UMass
- 9-Line Prediction: BYU v. UNLV
- 9-Line Prediction: BYU v. Fresno St.
- 9-Line Prediction: BYU v. SJSU
- 9-Line Prediction: BYU v. ECU
- 9-Line Prediction: BYU v. Mississippi State
- 9-Line Prediction: BYU v. Boise State
- 9-Line Prediction: BYU at Utah State
- 9-Line Prediction: BYU v. Wisconsin
- How BYU’s offense & defense have stacked up since 2005
- 9-Line Prediction: BYU v. Utah
- 9-Line Prediction: BYU v. LSU
- 9-Line Prediction: BYU v. Portland State
- By the Numbers: 2017 Season Preview
Cougar Brain Trust: 2014 Season Review
- Updated: December 16, 2014
Before the 2014 season began, we asked a panel of 60 BYU experts a few questions about the upcoming season. Today, we’ll look back at the regular season to see where the reality differed from the predictions and if possible, quantify the reasons for any differences. The Brain Trust finished 51-49 in the game-by-game predictions and needs a good showing to stay above .500 for the season.
Offense
1. Jamaal Williams Rushing Yards – 43% said between 1051-1150. Actual total: 518. Most of the voters didn’t predict that Jamaal would miss three games due to injury and average only 65 rushing yards per game in the remainder, breaking the century mark only against Houston and Utah State. Only 10% of the Brain Trust correctly predicted that he would finish with fewer than 950 yards rushing.
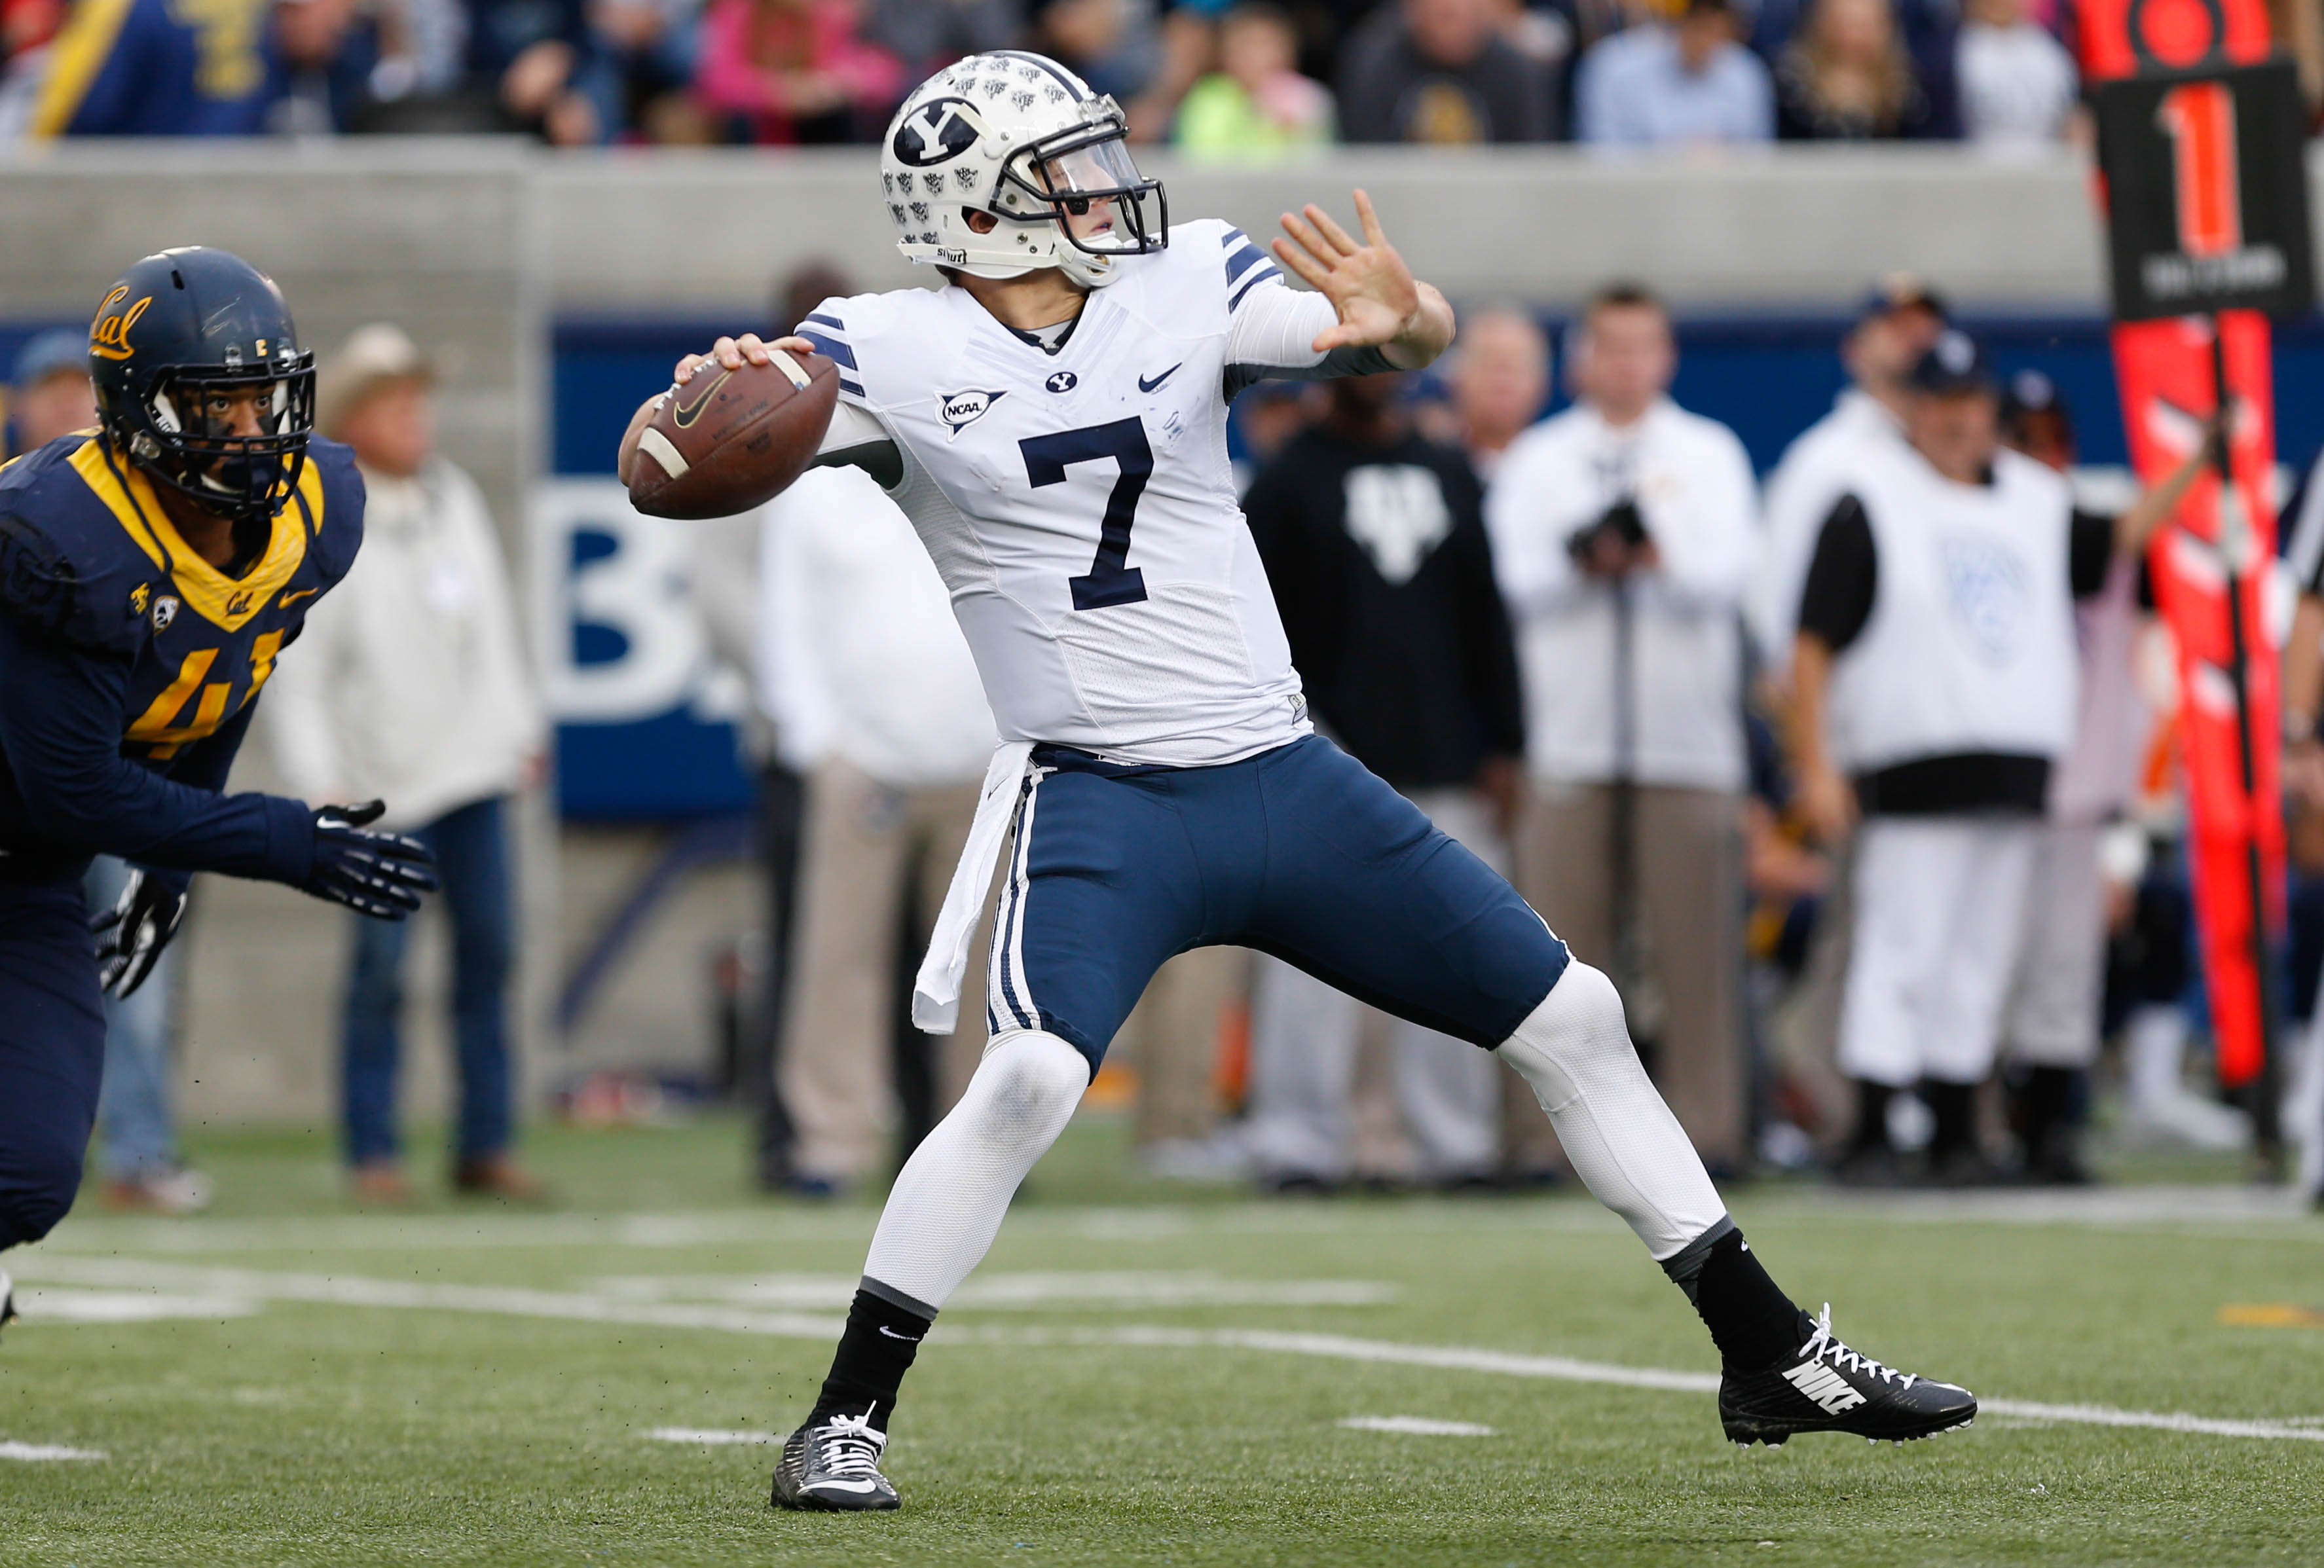
2. Leading WR Fantasy Points – 62% said Jordan Leslie. Actual leader: Mitch Mathews. Leslie’s 155-yard, 2 touchdown performance against Cal was not enough to surpass Mathews’ season totals. Mitch finished with 10 more receptions, 84 more yards, and 3 more touchdowns than Leslie. Mathews was the second-most popular option, with 28% of the vote, so the voters at least had the top two correct.
3. Higher total: Taysom passing yards or the sum of Taysom’s rushing yards plus a 200 yard bonus for each game played – 52% correctly picked the rushing yards plus the bonus. Going into the season, there was an expectation that the passing game would play a larger role in Taysom Hill’s arsenal and his own personal rushing load would decrease. This did not prove to be the case. In 2013, Hill averaged 33.7 pass attempts and 18.9 rush attempts per game. In 4.5 games of action in 2014, he averaged 29.3 pass attempts and 19.3 rush attempts per game. The result was 975 passing yards and 460 rush yards. Adding in the bonus pushed the totals to 975 and 1460, not nearly as close as expected.
4. Taysom Hill Completion Percentage – 55% predicted between 55 and 60% completion. Actual: 66.7%. Most fans were correct in assuming that Taysom would improve upon 2013’s 54% completion rate with another year of experience running the Anae offense. But, just one voter correctly guessed that his completion rate would rise above 65%. Though some improvement was expected, almost no one could have foretold that Taysom would add 25 points to his 2013 passer rating (2014: 142.75, 2013: 118.15).
5. FBS Offensive Plays per Game Rank – 47% predicted 2nd or 3rd. Actual: 10th (79.83 plays per game). Most fans believed that BYU’s offense would produce a similar output to 2013, when the Cougars ranked 3rd in the nation, averaging 85.46 plays per game. In actuality, BYU finished 2014 averaging 5-6 plays per game less than its 2013 output. 35% of the voters correctly presumed that BYU would finish between 4th and 10th.
6. Longest Offensive Play – 60% said between 65 and 79 yards. Actual: Jordan Leslie 83-yd reception at Cal. The 2013 BYU offense lacked an ability for big plays and most voters predicted similar results in 2014. Just 35% of the Brain Trust were correct in guessing that BYU’s longest play from scrimmage would go for 80 yards or more.
7. BYU’s Red Zone TD Percentage – 50% predicted between 50 and 60%. Actual: 71.4%. As was the case with Hill’s completion percentage, most fans predicted just a modest improvement in scoring touchdowns in the red zone. No one predicted this magnitude of improvement. BYU ended 2013 with a 48.2% RZTD%, ranked 113th in the FBS. In 2014, BYU’s percentage of 71.4% is good for 12th in FBS. BYU went from 11th-worst to 12th-best in the nation in this category, a remarkable improvement in just one season. Only 5% of the Brain Trust voters were correct in predicting a RZTD% of 70% or higher.
Offensive Predictions: 1-6. Ouch.
Defense/Special Teams
1. More tackles: All Linebackers combined or everyone else combined? – 73% said the linebackers would combine for more tackles. Actual: LBs totaled 340 tackles. All others totaled 498. I predicted against the majority on this one, and I turned out to be right. Even in 2013, the non-LBs finished with 120 more tackles than the LB group. The secondary was expected to be improved, but I didn’t expect it to be that much improved and that certainly proved to be the case. The 27% minority were right.
2. Higher total: Fumbles recovered by BYU or BYU defensive 4th Down stops? – 57% said the defense would recover more fumbles. Actual: 10 fumbles recovered, 11 4th Down stops. This statistic went back and forth a few times over the course of the season, but ultimately, the 4th Down stops won out again, though not by as wide a margin as 2013 when BYU’s defense also recovered 10 fumbles, but forced 15 4th down stops.
3. Number of games BYU defense allows 24+ points – 48% predicted 4-6 games. Actual: 7. First, the good news: for the first time ever under Coach Mendenhall, BYU went an entire regular season without allowing a single opponent to score on defense or special teams. The bad news? In 2013, BYU’s defense only allowed two teams to score 24 or more points. And while fans expected the Cougar defense to allow more teams to reach the 24-point threshold against a more difficult schedule in 2014, few predicted that seven opponents would achieve that distinction (or that 165th-ranked UNLV would come up just a point shy of becoming the eighth). Just 7% of the voters were correct in predicting that more than 6 BYU opponents would surpass the 24-point mark.
4. Number of games BYU defense allows 200+ rushing yards – 72% correctly guessed 2 or fewer. In this respect, BYU’s defense improved upon a 2013 campaign in which it allowed four opponents to run for 200 yards. Only Boise State achieved that metric in 2014, though UNLV (199), Virginia (192) and Cal (173) weren’t too far off.
5. Safeties, D/ST TDs, Blocked Kicks by BYU – 55% correctly predicted 6-8. BYU matched its 2013 total of 8 (1 safety, 3 defensive TDs, 0 special teams TDs, 4 blocked kicks) in 2014 by scoring 3 safeties, 1 defensive TD, 1 special teams TD, and recording 3 blocked kicks.
6. Total punts inside the 20 minus touchbacks – 46% predicted 10-16. Actual: 24. The motivation behind this question was to predict the effect of losing Daniel Sorensen and his punt-downing abilities. As it turns out, the question seems to be more of a reflection of Scott Arellano’s abilities. And while Arellano performed admirably in 2013, placing 28 punts inside the 20 with 10 resulting in touchbacks, he improved upon those numbers in 2014. This season, Scott placed 26 punts inside the 20 with only 2 touchbacks. Only 3% of the Brain Trust predicted a total of 17 or greater. Arellano’s abilities will surely be missed in 2015.
Defense/Special Teams Predictions: 2-4. Slightly better than the offensive ones I suppose.


